For chiropractors, this is practical and powerful. HRV helps you see how the nervous system organizes energy and recovery. A higher HRV often reflects stronger parasympathetic responsiveness and better adaptability. Low HRV can signal sympathetic overdrive, poor sleep, dehydration, illness, or simply a tougher week. The aim is not to chase someone else’s number. The aim is to read what your patient’s physiology is saying and use those signals to support your exam, your report, and the care plan you design.
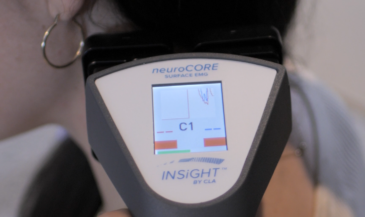
This guide explains what heart rate variability measures, why normal HRV is personal, what influences HRV across the lifespan, and how consistent monitoring helps you make better clinical decisions. We will also connect these principles to INSiGHT scanning technology, including neuroPULSE HRV inside INSiGHT software (powered by Synapse), so you can turn complex physiology into simple, credible scan views that patients understand.
Heart rate variability describes the small differences in time intervals between heart beats, measured in milliseconds. These variations come from the balance within the autonomic nervous system, where the parasympathetic nervous system slows the heart and the sympathetic nervous system speeds it. In practical language, HRV measures how flexibly the body can move between energy expenditure and recovery. Higher HRV indicates stronger parasympathetic responsiveness and a system that can settle and restore when life allows. Lower HRV may correlate with sympathetic dominance or neurological distress from heavy training loads, schedule changes, dehydration, illness, or poor sleep.
Do not over-interpret a single reading. HRV can fluctuate day to day. The clinical value appears when you look at HRV over time. Watch how your baseline behaves during easier weeks, harder weeks, travel, or recovery periods. This helps you add context to an otherwise small number on a screen. HRV indicates flexibility when the system is challenged and then settles. Seen this way, the number becomes a conversation about adaptive capacity rather than a pass-or-fail score.
“Normal” Is Personal: Population Context vs Individual Baselines
People often ask for a normal heart rate variability number. The honest answer is that HRV varies widely. Community datasets commonly show adults spread across a broad heart rate variability range. Many general-population references cite values spanning roughly 19 to 75 milliseconds, with an average in the 40s. Device communities differ as well. An athletic cohort will often post a higher average HRV than a general group, while new parents with limited sleep may run lower for a season. The lesson is simple. Use population charts as context, then build a personal baseline.
In practice, help patients collect consistent measurements and watch HRV values across weeks and months. HRV may look choppy at first. With consistent routines it often stabilizes into a characteristic pattern. If HRV falls for several days, correlate that dip with changes in schedule, travel, workload, hydration, or recovery to interpret context. Make small adjustments and observe. Over time, this patient-centered approach helps improve HRV consistency and makes the numbers clinically useful.
Key point: There is no single normal HRV. Use population averages as context, then build a personal baseline and follow HRV trends over time.
HRV by Age: What Changes Across the Lifespan
A consistent finding across multiple population studies is that HRV tends to decline with age. The magnitude of the decline in HRV depends on the individual and the dataset. HRV naturally decreases with age on average, but that trajectory can be softened by resilient sleep, activity, and recovery habits. In other words, decreases as you age are common, not guaranteed.
Factors such as age, fitness level, sex, and genetics interact. Depending on age and lifestyle, some people maintain relatively stable baselines for years. Others see more pronounced shifts during life transitions. When HRV decreases or drifts lower for an extended period, consider workload, sleep compression, medication changes, and broader life events before drawing conclusions. This age-aware view makes it easier to give practical feedback without overreacting to a single number.
Learn more about INSiGHT scanning?
Fill this out and we’ll get in touch!
"*" indicates required fields
Establishing a Baseline: How to Measure HRV Well
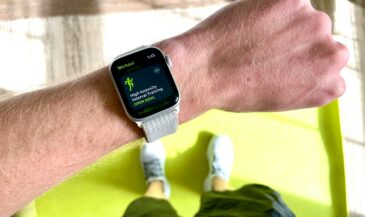
Because HRV is a highly sensitive signal, consistency matters. The best way to track heart rate variability is to measure at the same time and in the same context each day. Many HRV monitors gather data during sleep to avoid daytime noise. If you do not use a wearable, pair a validated heart rate monitoring app with a chest strap or accurate sensor and test first thing in the morning before stimulants or training. Consistency reduces noise and gives you a baseline you can trust.
Overnight or early-morning readings reduce confounders and build a stable reference. Monitoring your HRV this way lets you see HRV trends without overreacting to single readings. If you prefer to test post-wake, keep the protocol identical daily. Your goal is a durable picture of HRV over time, from which you can spot a decrease in HRV or an encouraging rise after supportive habit changes. This is how you turn a small number into a strong guide for decisions that matter.
Reading a Heart Rate Variability Chart with Patients
A heart rate variability chart can help patients understand context. It shows averages by age or within a device community, so people can see broad patterns. Younger groups usually present higher HRV relative to older groups. Athletes often chart higher than general populations. Use these references as conversation starters, not diagnoses. If a patient asks whether an outlier means an abnormal heart, differentiate HRV from rhythm concerns. HRV reflects timing variability, while an abnormal heart rhythm is a separate clinical issue that requires appropriate evaluation.
Keep the conversation friendly and simple. The chart gives landmarks. Your patient’s baseline gives direction. This is how you avoid chasing someone else’s benchmark and instead lead a calmer, more practical dialogue about performance and recovery.
What Influences HRV Day to Day
Habits and environment affect your HRV metric more than most people realize. Good sleep hygiene, adequate hydration, predictable meals, and a balanced training plan all influence HRV. Psychological load and social events also impact HRV. Caffeine and alcohol timing matter. Travel, altitude, temperature swings, and seasonal changes can play roles as well. Factors like age and genetics set the background, but daily routines still produce visible patterns.
On the physiology side, a heavy sympathetic push raises your heart rate acutely. If recovery is limited, you may see lower heart rate variability for a few days as the body manages load. As training and breathing quality improve, parasympathetic tone can gain traction and support a steadier pattern. Always interpret changes alongside subjective experience and schedule context so your recommendations feel sensible and achievable.
How to Improve HRV Consistency
The goal is not simply high HRV. The goal is a flexible, resilient pattern that fits the life a person is living. Here are practical steps that help improve HRV over time without obsessing over a single score:
- Prioritize consistent sleep timing and duration. Guard the first half of the night for deep sleep so the resting heart has a chance to settle.
- Balance training and recovery. Alternate intensity days with lower load to increase HRV gradually instead of forcing it suddenly.
- Use slow nasal breathing and extended exhalation to stimulate vagal activity and calm heart rhythm at rest.
- Hydrate earlier in the day, taper stimulants, and avoid late alcohol to support a smoother average heart rate overnight.
- Eat at predictable times, and avoid very late meals that elevate nocturnal heart rate and reduce recovery quality.
- Create wind-down rituals to lower arousal before bed and keep a simple plan you can repeat on busy nights.
If you coach athletes, it can be useful to use heart rate variability to plan broader phases of load and recovery and even variability to plan your workouts in a conservative way. Match the HRV score with subjective readiness, sleep data, and the training calendar. HRV is associated with recovery capacity, but it is one signal among many, so give it context and you will help people make better day-to-day decisions.
Context Matters: HRV, Fitness, and Clinical Boundaries
Public discussions sometimes overpromise. High HRV is generally linked with robust recovery and efficient regulation, but it is not a guarantee of performance or resilience in every moment. Low heart rate variability can appear during illness or after periods of overload, yet it can also reflect a temporary response to a demanding season. Context guides the conversation. For the average person, resilient routines support overall health and a steadier profile across weeks and months. That is what you want to reinforce in the clinic.
Keep scope clear. HRV does not diagnose disease. If someone reports palpitations or signs consistent with an abnormal heart rhythm, that requires medical evaluation. HRV is also not a substitute for clinical workups of heart conditions. Be plain about this. HRV is a timing signal that reflects the body’s regulation. You are using it to learn how someone is adapting, not to label disease.
Communicating HRV in the Adjusting Room
HRV is most useful when it becomes part of a simple, repeatable dialogue in the adjusting room. Explain that HRV often runs higher on easy weeks and lower on demanding ones, and that trends matter more than any single value. Avoid fear language. If a reading is off, ask about travel, late nights, hydration, and workload before assuming trouble. This helps patients view the nervous system as a dynamic regulator rather than a pass-or-fail test. It also makes your care plan conversations calmer and more credible.
Use language that fits neurologically focused practice. You are looking at how the nervous system allocates energy and recovers. When patterns improve and become steadier, adaptability grows. That is the kind of change patients can feel in daily life. They also appreciate seeing it on a report, which is where scanning adds so much value.
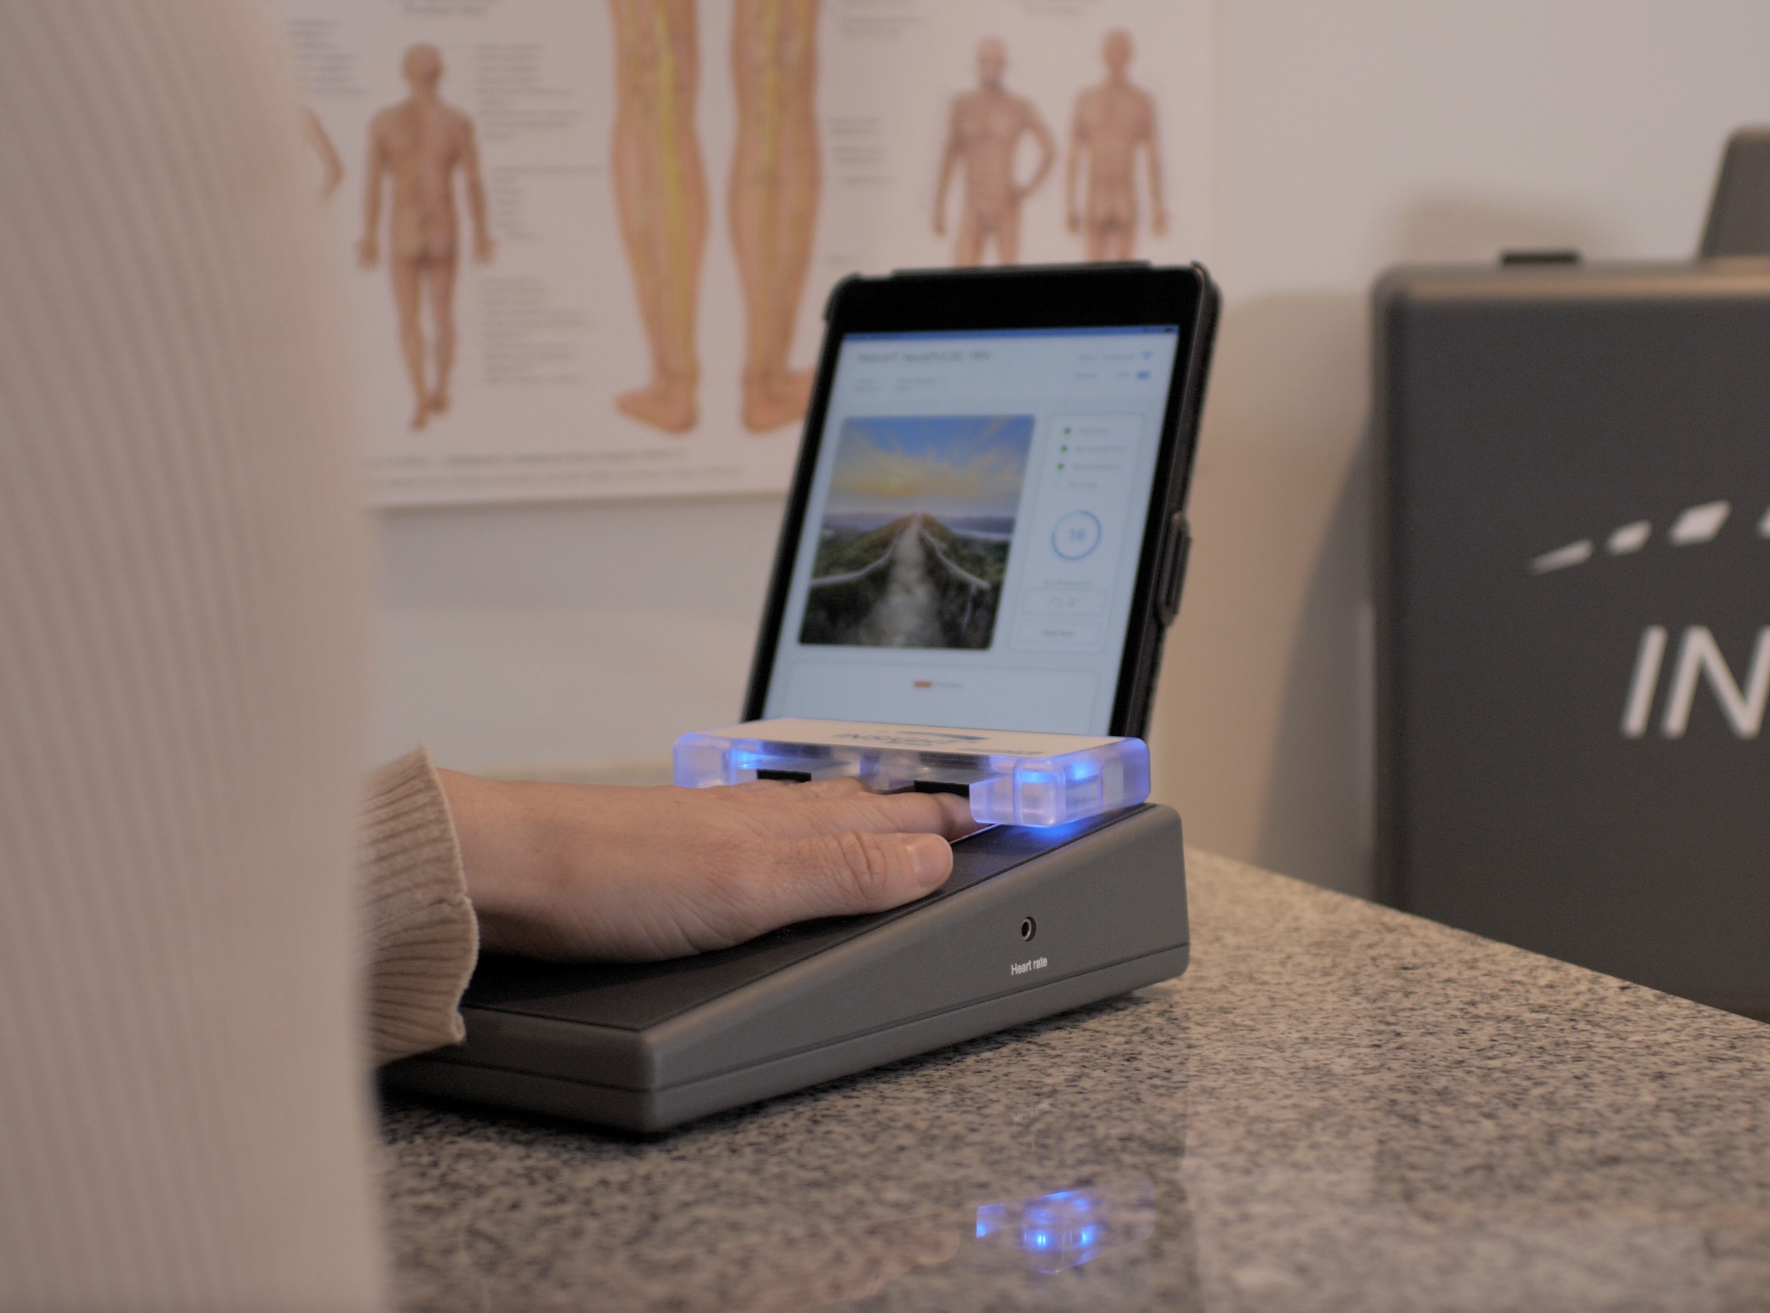
Interpreting HRV with INSiGHT neuroPULSE and the Rainbow Graph
INSiGHT scanning technology brings objectivity to the conversation. neuroPULSE HRV connects to the Rainbow Graph inside INSiGHT software (powered by Synapse) to show two things at once. The X-axis represents autonomic balance. The Y-axis reflects activity or reserve. The white dot’s location shows whether a person is leaning sympathetic or parasympathetic and whether their activity is robust or depleted. Colored regions make these distinctions easy to see across ages and backgrounds.
These scan views turn complex timing data into an approachable picture. You can track heart rate variability across visits, show HRV trends over time, and demonstrate how lifestyle adjustments and consistent chiropractic adjustments are supporting adaptability. INSiGHT produces objective exam data and reports. The chiropractor interprets that information alongside the full exam and history and then designs the care plan. That clarity builds trust and reinforces consistency from the first exam through regular progress checks.
HRV for Athletes and Busy Patients
People often ask whether HRV alone should dictate their day. Use a balanced approach. Pair the number with perceived energy, soreness, the training calendar, and the bigger life picture. HRV or heart readiness can warn you if the last few days have been taxing. Sometimes your heart and head say different things. The art is balancing both so you avoid overreaching during a heavy stretch and keep recovery blocks on the calendar with less guesswork.
Practical Measurement Tips You Can Share
- Test in a stable state. Overnight measurements or first-thing morning sessions work well.
- Keep protocols identical. Same device, same time, same position, and similar breathing.
- Mind the basics. Hydration, earlier meals, and a consistent bedtime will give you a good foundation for steadier readings.
- Use parallel markers. Track perceived energy, sleep quality, soreness, and simple notes about schedule changes.
- Be patient. HRV often needs a few weeks to reveal a signature pattern as routines settle in.
Frequently Asked Questions
What is good HRV? Good HRV is the stable pattern that suits your life and improves gradually in consistency. Avoid comparing yourself to others and focus on your baseline and the behaviors that support it.
What is the normal HRV range? Population charts show broad spreads and device-specific averages. Use those as landmarks, then build a personal baseline and follow it over months.
Can I improve your HRV with breathing and routine? Yes. Breath work, steadier sleep timing, earlier hydration, and smarter training can help improve. Start with what you can repeat and adjust gently.
Why did my number drop for a few days? Look for travel, later nights, extra training, illness, or big schedule changes. Adjust, watch, and recheck. Small course corrections go a long way.
How often should I test? Daily readings in a consistent window are best. Many prefer overnight testing for convenience and accuracy. Tracking your HRV this way reveals patterns you can act on.
Bringing It All Together
HRV is personal. Use population references as orienting landmarks, then commit to consistent measurement and simple routines that support adaptability. In practice, combine HRV with neurologically focused exams so the conversation is clear and credible. With INSiGHT neuroPULSE HRV and the Rainbow Graph, reporting becomes visual and persuasive, making it easier to explain how the nervous system adapts and how your care plan supports steady progress over time. When patients see this picture, they understand why consistency matters and how small daily choices shape their capacity to handle life’s load.