Getting Familiar With PWP (HRV) Scans
As you are aware, Heart Rate Variability (HRV) is a system of analysis that looks at the interbeat interval (IBI) of a resting heart rate. Over a 5-minute collection period this IBI is analyzed to interpret the different spectrums of frequencies associated with Sympathetic (S) and Parasympathetic (PS) activity. Because we are interested in the variability of these IBI’s, a nonlinear form of fractal analysis is used to gain a plot point.

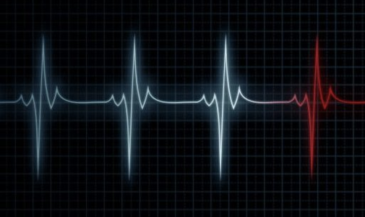
Red Lines and Blue Lines
The actual red line on the graph that is produced is the Instantaneous Heart Rate (IHR). The IBI is the “fractal” associated with the IHR. If you remember the QRST wave of a heartbeat, the IBI represents the R-R interval. Looking at the redline produces little information relevant to an HRV interpretation. However, it can be useful to ensure that a good collection has occurred. If there are very wide and unusual patterns being displayed in the IHR, chances are that the collection is flawed. Poor finger contact due to excessive sweaty palms and fingertips can alter the data. Of interest is when we look at the redline in relation to the blue SCR line. The blue line is looking at a skin conductance response (SCR). Essentially, when there is altered skin conductance outside of the normative range associated with a state of heightened anxiety. If there is a sharp “jolt” in the blue line with a corresponding jump in the red, IHR line, you can assume that the HRV data for that fractal was altered. If this happens once or twice in the 5 min collection, these jumps can be viewed as an artifact as the other fractal data will even out the intrusive one. More commonly the blue line will be erratic and will jump above the normative line a number of times. If the activity is consistently above the line, redo the test. We recommend that there be less than 5 line jumps over a 5-minute collection to retain the scan data.
PWP Interpretation Basics
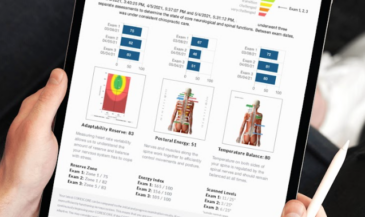
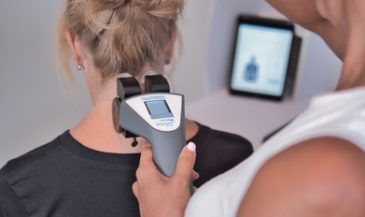
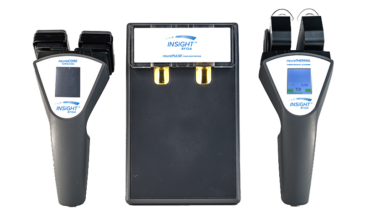
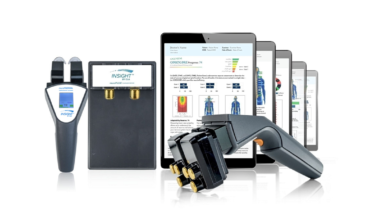
The inclusion of the SCR combined with the HR collection technology along with use of temperature sensing means that CLA’s unit offers a unique advancement in HRV technology, which we refer to as the Pulse Wave Profiler (PWP).
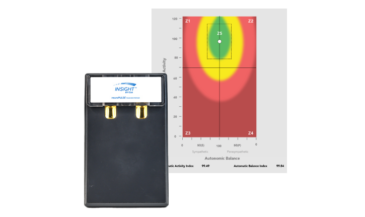
When you look at the graph produced after a PWP collection you will see that it is an X and Y axis with a green box positioned above the centerline at the 80 mark extending to the 100 score. You will also note that there are 3 parabolic shaped, colored regions surrounding the green box: yellow, orange and red. Very simply, the shift to the left or the right represents an inability for the body to hold good balance between the S and PS systems. A plot to the left of the centerline indicates Sympathetic dominance and a shift to right means PS dominance. Autonomic activity, which is a reference to the degree of adaptability, is related to the Y-axis. Complex calculations produce a plot-point, which we can now recognize as a combination of balance and variability in relation to a patient’s autonomic reserve and their resiliency.
How to read the graph
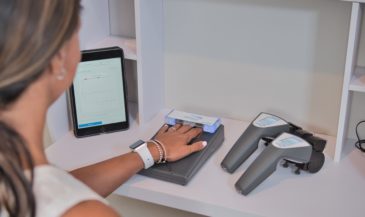
Before you look at the graph, review the Redline/Blueline graph and determine if you are satisfied that you are interpreting a valid plot. Remember, that before a collection can occur there are three ” green” lights that the patient must pass This mean that their heart rate, temperature and galvanic skin response had to have been within acceptable parameters to begin the collection and there is a 30 second to 1 minute lead in time for the patient to acclimatize to the technology. Quickly review the blue anxiety line to see if it complies. Most likely, with these fail-safes in place, you are getting a true read of the patients HRV/ adaptive state.
Now look at the plot point on the graph. Is it Right or Left of center? To the Left represents a skew towards Sympathetic imbalance and dominance. This will happen in the majority of scans. Is there is a Right shift; the patient is tilted toward PS dominance. This can be viewed as being more desirable than a Left shift, but perfect balance is the goal and the ideal. Getting into the mid to high 90’s on the Autonomic Balance score is a very real goal. Next, look to see how far Left or Right the plot is. Of special interest is when the score is at the far reaches of the Left (S) border, which correlates to a score of 12.5. placing it within the yellow region. We have found that this extreme plot is usually associated with an event producing high adrenaline response. Most typically it is related to post-exercise or personal events such as commuter driving or family situations. It is recommended that the exam be redone or the patient questioned as to whether they have worked out or been subjected to undue stress within the past 3-6 hours. Consistent 12.5 plots on subsequent exams indicate a significant “adrenalined up” status.
Most commonly, the S scores are in the 40-70 ranges and the plot shows a dropping off of the Autonomic Activity score. It is, unfortunately, common to find a plot in the Orange zone with an S- skew. We understand the mechanism of this shift to be associated with excessive, prolonged Sympathetic activity that gradually fatigues the recovery response, hence the drop downwards on the vertical plot.
What does it all mean?
Here are the two most important points to reflect on when interpreting a PWP plot.
- Is the patient tilted out of balance toward the S side?
- How far down the vertical axis is the patient?
What these two observations mean?
- When a plot is off balance towards on the LHS, it is really a reflection of poor Vagal braking. Remember that the Sympathetic feeds into the Sino-Atrial node come from the upper thoracic sympathetic spinal chains. The parasympathetic feed is from the tenth cranial nerve, the Vagus nerve. The Vagus nerve secretes acetylcholine as a neurotransmitter, which has a dramatic effect on lowering the heart rate. The Vagus is associated with the regulation of visceral functions as well as HR modulation.
Although we could spend time looking at the “adrenalined up” lifestyles or events, the real story is in the braking. Imagine driving a Porsche. All the power and handling you could want but extremely vulnerable and dangerous to drive if the brakes are poor. The same applies here. If the PS (Vagal) Braking is impaired from overuse combined with excessive S-Lifestyle choices, then the plot will shift and stay shifted to the LHS. One of the most powerful modulators to this persistent L shift is the adjustment. Zhang found that chiropractic care induced better autonomic balance. Unhealthy lifestyle choices fatigue the braking response and feeds into the overt Sympathetic situation. Adjustments and certain lifestyle modifications shift the balance back towards a healthier centerline plot.
The second point to reflect upon is the vertical plot associated with Autonomic Activity. Simply put, this represents the amount of reserve and resiliency that the patient is working with. We used to define this reserve as their amount of “Coping Capacity.” CLA now teaches this concept by using the acronym, GAP: General Adaptive Potential. This is a foundational principle of the chiropractic premise that CLA has reworked. Imagine that a combination of lifestyle stressors and events constantly “pushes” down on us while our inborn, internal capacities resist this pressure. Now imagine that this “Equation of Life” is being played out under the guidance of the central nervous system. If the external forces gradually overwhelm the internal resistance and interfere with the nervous system, the GAP is narrowed. A simple visual to work from can be created by holding your hands apart, palms inward and separated by a few inches. The space between the hands represents the width of the GAP. As stresses overwhelm the body’s resources, the GAP narrows and the hands come closer together.
Widening the GAP is desirable. The healthy and well people find their plots within the green box on the PWP graph. This allows for a bit of imbalance but the reserve must be high; within the 80-100 range. Having a narrower GAP and, therefore, a lower Autonomic Activity score puts the patient in a vulnerable position. They don’t have the necessary reserves to remain resilient in the face of ongoing or upcoming stressors. They have a suppressed recovery response and as the stresses accumulate or continue their health status can decline more rapidly. The statement of “getting sicker, quicker” applies here.
In Conclusion
These are the basic points to remember when viewing and interpreting the PWP/HRV graph. Of note: The original HRV work done with Navy Seals and Russian Olympians found that plots high above the green box and to the PS side of the centerline represented the most desirable, highly adaptable situation. Conversely a plot to the lowest Left quadrant was significant with respect to failing health and vulnerability. We coined this plot, “the morbidity shift.” Because this is a heart related test, it is advisable for the clinician to discuss the cardiac health of the patient should this plot persist.

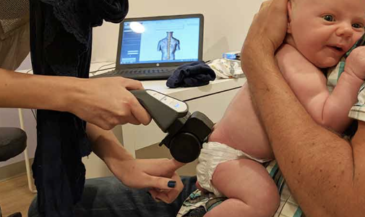
More importantly it is a dynamic, non-invasive, non-spinal test that can become a staff-driven procedure. This means that a progressive folio of scans can track a patient’s response to chiropractic care outside of the traditional spinal function procedures. PWP scanning should become the focal point of care plan decision-making and wellness discussions as the patients get tested on a consistent quarterly basis throughout their lifetime. Think about it, who wouldn’t want to be aware of their level of adaptability along with their capacity for stress management? The most exciting knowledge is that chiropractic care exerts a significant influence on the improvement of HRV scores. It’s easy to see why CLA’s PWP is the jewel in the crown of the chiropractic wellness movement.
Thanks for reading!