

At first glance, these measurements can feel overwhelming.
What do they actually mean?
Which numbers matter most?
Should you be concerned if one is low or another is high?
The good news is that you don’t need to become a cardiovascular researcher to understand the basics. Once you know what these metrics measure, they become useful tools for understanding how your nervous system is responding to stress, recovery, and adaptation.
Let’s break down the most common HRV measurements you’ll encounter.
A Quick Refresher on HRV
Heart Rate Variability (HRV) measures the variation in time between consecutive heartbeats.
Although your heart may beat approximately 60 times per minute, those beats are not evenly spaced. The interval between each heartbeat constantly changes as your autonomic nervous system responds to your body’s needs.
These tiny variations provide valuable information about how effectively your nervous system regulates stress, recovery, and overall adaptability.
HRV software doesn’t simply calculate one number. Instead, it analyzes the heartbeat data in several different ways, producing multiple metrics that each describe a different aspect of autonomic function.
SDNN: Overall Heart Rate Variability
SDNN stands for Standard Deviation of Normal-to-Normal Intervals.
Despite the intimidating name, SDNN is simply a measure of your overall HRV.
Think of SDNN as a broad summary of how much your heartbeat intervals vary during the recording period.
Generally speaking:
- Higher SDNN suggests greater overall variability.
- Lower SDNN suggests reduced variability.
Because SDNN reflects total variability, it is commonly used in both clinical research and healthcare settings to evaluate overall autonomic nervous system function.
Learn more about INSiGHT scanning?
Fill this out and we’ll get in touch!
"*" indicates required fields
RMSSD: Short-Term Recovery and Parasympathetic Activity
RMSSD stands for Root Mean Square of Successive Differences.
Fortunately, you don’t need to memorize the name.
What matters is what it represents.
RMSSD focuses on the small beat-to-beat differences between consecutive heartbeats and is strongly influenced by parasympathetic nervous system activity.
For this reason, RMSSD is often associated with:
- Recovery
- Rest
- Relaxation
- Nervous system adaptability
Many consumer wearables rely heavily on RMSSD because it responds well to short recording periods and provides useful information about day-to-day recovery.
Within standardized clinical HRV assessments, RMSSD is also one of the important measurements evaluated alongside other HRV metrics.
Frequency Domain Measurements
Some HRV reports include measurements called LF, HF, and the LF/HF Ratio.
These belong to what’s known as frequency domain analysis.
Rather than simply measuring how much variability exists, frequency analysis looks at how that variability is distributed across different rhythmic patterns.
While these measurements remain valuable in research, interpreting them correctly requires caution because they are influenced by numerous physiological factors.
HF (High Frequency)
High Frequency (HF) activity is generally associated with parasympathetic nervous system activity.
Because breathing naturally influences heart rhythm, HF is closely connected with respiratory activity and relaxation.
Higher HF values often occur during restful states when parasympathetic influence is greater.
LF (Low Frequency)
Low Frequency (LF) has historically been more difficult to interpret.
Years ago, LF was often described as representing sympathetic nervous system activity.
Modern research has shown that the reality is more complex.
LF reflects a combination of multiple physiological control mechanisms, including influences from both sympathetic and parasympathetic regulation.
Because of this complexity, most experts now recommend interpreting LF within the context of the entire HRV assessment rather than viewing it as a direct measure of stress alone.
LF/HF Ratio
The LF/HF Ratio attempts to compare these two frequency bands.
Historically, this ratio was sometimes presented as a measure of the balance between sympathetic and parasympathetic nervous system activity.
Today, many HRV researchers recognize that this interpretation can be overly simplistic.
While the LF/HF ratio can still provide useful information in certain situations, it should never be interpreted in isolation.
Instead, clinicians evaluate it alongside other HRV measurements and the patient’s overall clinical presentation.
Heart Rate Matters Too
One interesting aspect of HRV is that it should not be interpreted separately from heart rate.
Two people may have identical HRV values while having completely different resting heart rates.
Likewise, your own resting heart rate may influence how your HRV changes throughout periods of exercise, recovery, illness, or stress.
This is one reason why comprehensive HRV assessment considers multiple measurements together rather than relying on a single number.
Why No Single Metric Tells the Whole Story
Many people become fixated on improving one specific HRV number.
Perhaps they want a higher RMSSD.
Or a better LF/HF ratio.
The reality is that no individual HRV metric tells the complete story of nervous system function.
Each measurement contributes one piece of a much larger picture.
Just as blood pressure, heart rate, temperature, and oxygen saturation each provide different information during a physical examination, HRV metrics work together to create a more complete understanding of autonomic regulation.
Why Clinical Assessments Evaluate Multiple HRV Measurements
Standardized clinical HRV assessments typically examine several HRV metrics together rather than relying on one isolated value.
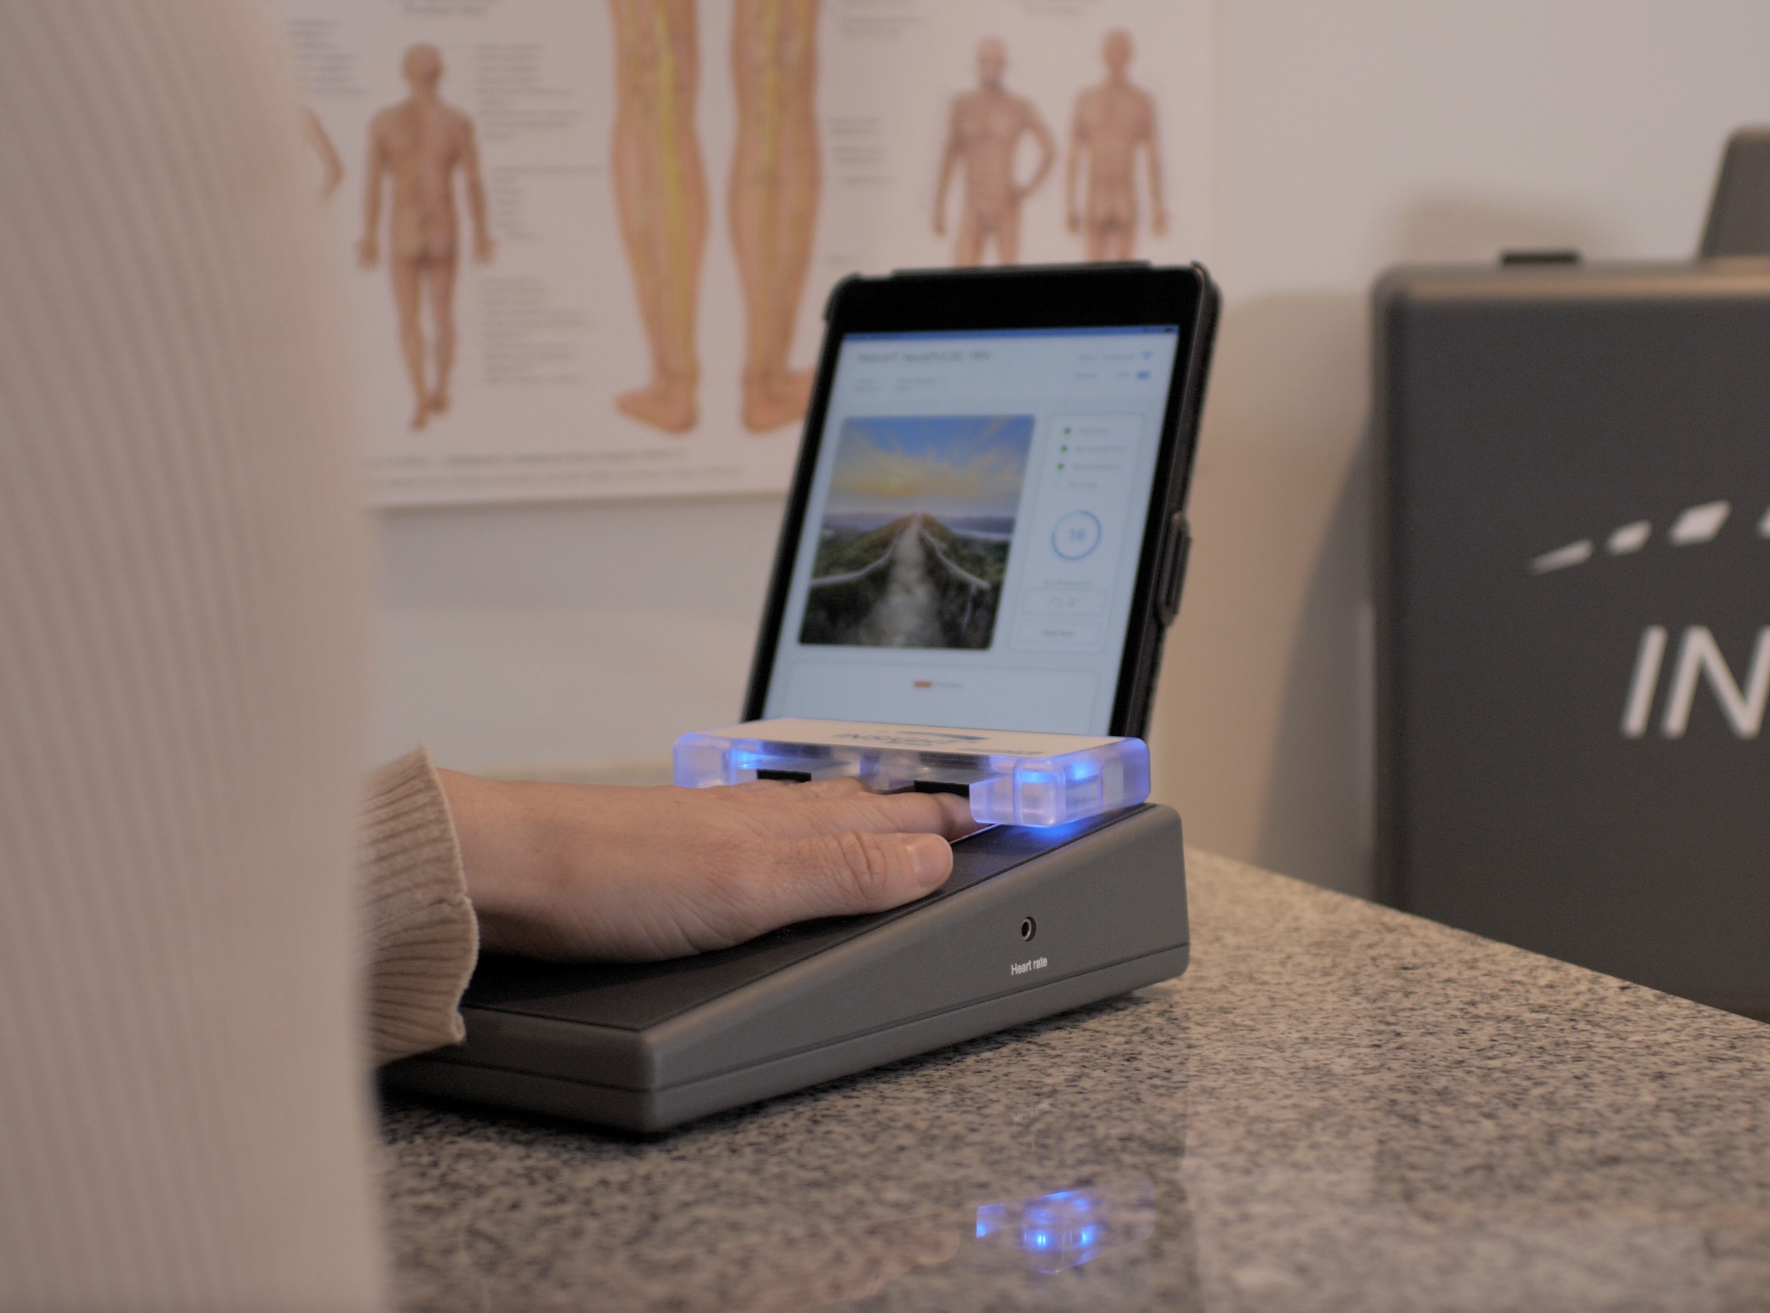
For example, the neuroPULSE technology within the INSiGHT scanning technology evaluates multiple HRV measurements, including SDNN and RMSSD, while collecting data under standardized clinical conditions.
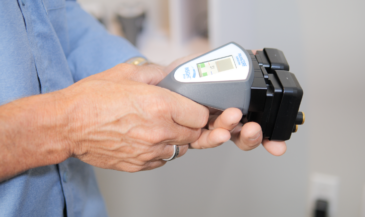
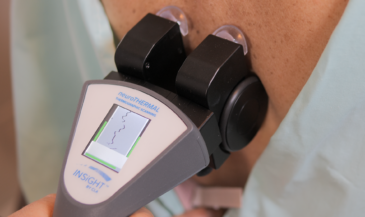
Rather than focusing on a single number, clinicians interpret these measurements collectively within the context of the patient’s overall neurological assessment. When combined with additional objective technologies such as neuroCORE (surface electromyography) and neuroTHERMAL scanning, HRV becomes one component of a broader evaluation of nervous system function.
Should You Compare Your Numbers to Someone Else?
One of the most common mistakes people make is comparing HRV metrics with friends, family members, or online averages.
For example:
“My RMSSD is lower than my coworker’s.”
“My SDNN doesn’t match the average I found online.”
These comparisons are rarely helpful.
HRV is influenced by many individual factors, including:
- Age
- Fitness level
- Genetics
- Sleep
- Stress
- Medications
- Health history
- Daily habits
Because of this, your own baseline is far more valuable than someone else’s numbers.
Tracking your trends over time usually provides much greater insight than comparing yourself with population averages.
Focus on the Big Picture
Whether you’re using a wearable device or receiving a clinical assessment, it’s important to remember that HRV metrics are tools for understanding your nervous system—not scores to chase.
A temporary decrease in RMSSD doesn’t necessarily mean something is wrong.
A higher SDNN isn’t automatically “better.”
Instead, these measurements should always be interpreted within the context of your overall health, recovery, lifestyle, and long-term trends.
The goal isn’t achieving perfect numbers.
The goal is understanding how your nervous system adapts over time.
As research continues to expand our understanding of HRV, these measurements remain valuable tools for helping both individuals and healthcare professionals better understand nervous system function, resilience, and adaptability.