Are you ready to dig deeper into using HRV in your practice? Let’s begin with a description of HRV and a simple orientation and use the Rainbow Graph.
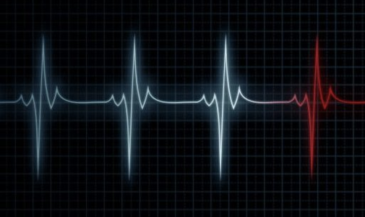
What does HRV measure?
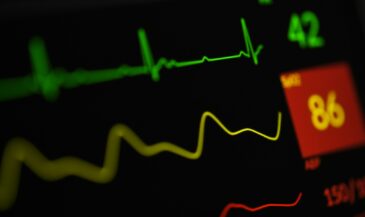
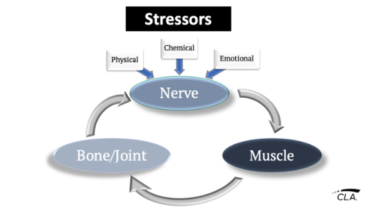
Your heartbeat is controlled by the interaction between the Sympathetic and Parasympathetic nerves. These two nerve systems come together in the sino-atrial node in the heart and believe it or not, your future well being is under this influence.
To survive we have to instantaneously react and adapt to threats. We have the Sympathetic nerves to watch over that side of the equation. The Fight-Flight response gets going when the S-nerves fire and adrenalin courses through the body. That’s great news when the threat is really BIG. But over time threats like poor posture, unhealthy food choices, money and relationship issues keep making the S-nerves work overtime and eventually this new S+ setting becomes the normal way of living … as if there is a threat around every corner. This is a very hard way to go through life and the wise body knows this. That is why we have a gift known as the Parasympathetic nerves. Their role is to calm down the Sympathetic storm and to allow the power of the Parasympathetic neurotransmitters to do their thing by resetting the entire metabolism, encouraging rest, recovery and restoration. How much do you love your Parasympathetic system now!! The Vagus nerve is responsible for controlling the PS activity and therefore measuring HRV allows us to check in on how well it is working.
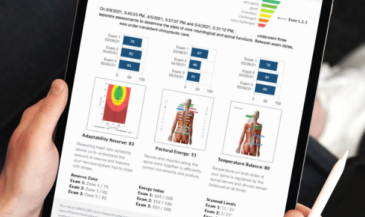
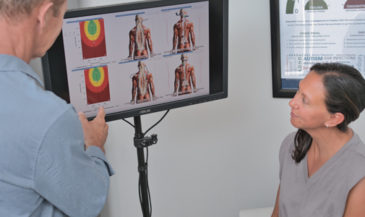
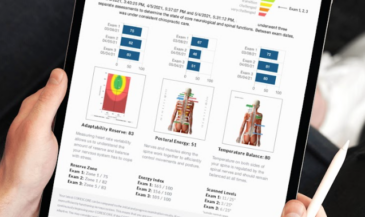
Adaptability Reserve Graph (HRV Rainbow Graph)
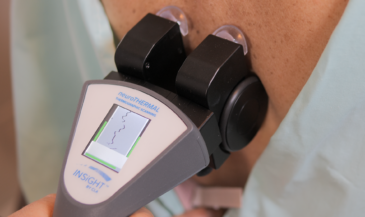
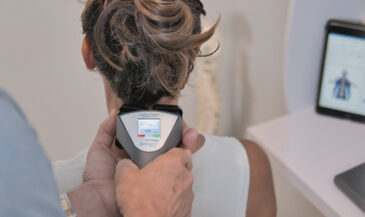
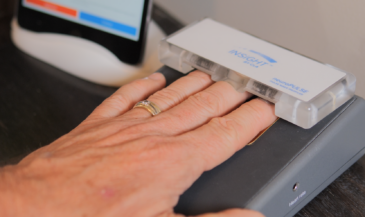
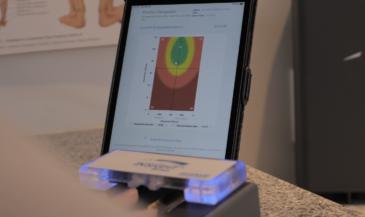
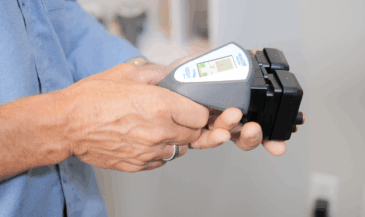
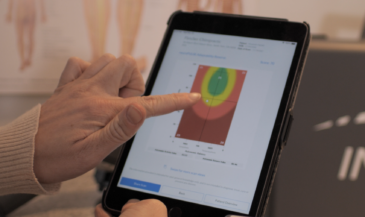
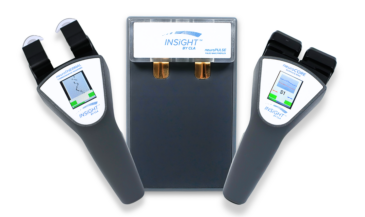
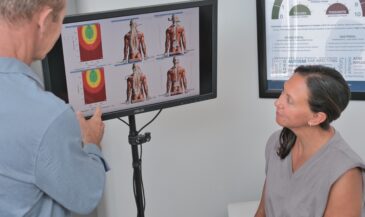
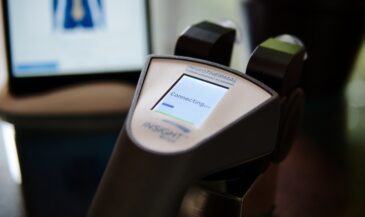
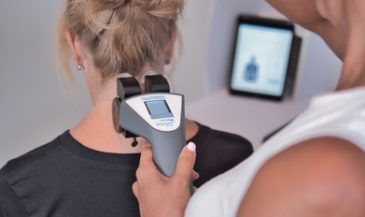
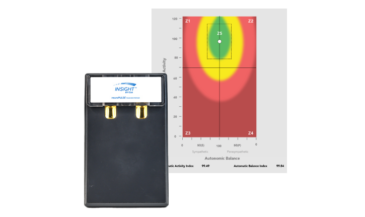
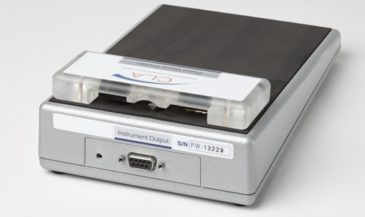
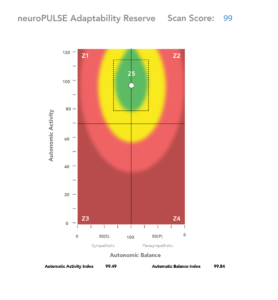
CLA’s neuroPULSE is graphed on a Rainbow Graph. This graph is the most important scan view when interpreting the neuroPULSE. It is designed on an X-Y axis with Balance being plotted on the horizontal X axis and Activity on the Y axis.
The vertical centerline represents the ideal operational “balance” between the activity in the Sympathetic(S) and Parasympathetic(P) nervous systems.
- Sympathetic dominance plots to the left of the centerline
- Parasympathetic Dominance plots to the right of the centerline
- The horizontal line, midway through the graph, represents an average, calculated threshold for activity within the autonomic nervous system. A plot below this line indicates a lower than desired level of activity indicating a lower adaptive reserve.
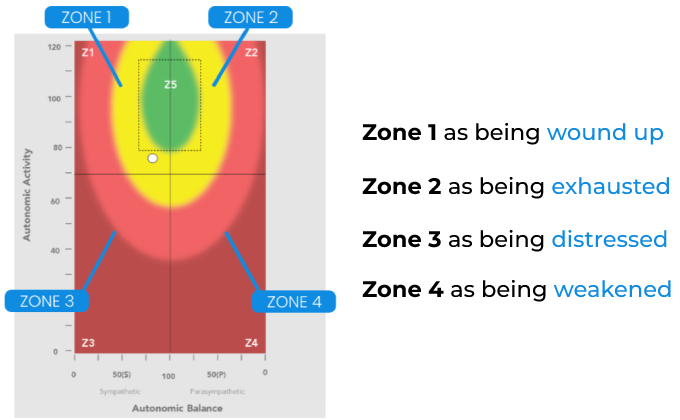
- The combination of the vertical and horizontal thresholds provides 4 quadrants or Zones 1-4 which have unique functional characteristics.
A 5th “Green Zone” represents the characteristics of a well adjusted patient, exhibiting above average AAI and ABI. This zone was derived from analysing significant amounts of data collected on a well-adjusted cohort of chiropractic patients. This zone can be viewed as representing a reasonable and preferred amount of adaptive reserve.
Some important facts about the Rainbow graph
- AAI is calculated from the amount of amplitude that is within the frequencies associated with the SYMPATHETIC (S) and PARASYMPATHETIC (PS) divisions of the CNS.
-
- ABI represents the balance between the S (Low Frequency) and PS(High Frequency) activity.
- The patient’s plot, which is a white dot, will score within one of FIVE zones, with the Green Zone being the most desirable as it represents a well adjusted state.
- The higher the plot in the green zone, the better.
- This data and the calculations are available in the ‘Table view’, accessed by swiping left after viewing the Rainbow graph.
- The yellow, orange and red regions provide a visual perspective ,so that the patient can recognize where they are in relation to the Green Zone. Yellow can be described as being “Category 1 stress,” “Orange: Category 2 Stress;” “Red: Category 3 stress”.
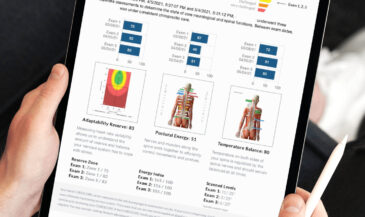
- Zones 1-4 represent unique interpretations of the HRV data, which are published in the scan and CORESCORE reports.
Let’s look at the highlights of each Zone:
- Zone 1 is the upper LEFT Quadrant. The patient is highly Sympathetic and also has high amounts of adaptive reserve. We sometimes refer to this zone as a Crossfitter’s plot. Because there is a high Reserve, the dominant sympathetic activity represents a diminished state of recovery. Rather than focusing on the drivers of the Sympathetic “ Fight-Flight” activity, this quadrant should be viewed as indicating lower than desired Parasympathetic responsiveness. The parasympathetics are able to modulate the constant S activity so that the patient constantly remains in an S dominant state. Crossfitters typically over train yet are healthy and strive to remain wellness oriented. Their positive lifestyle choices keep the activity of the Autonomics at a desirable level for the time being. One of the goals in managing Zone 1 patients is to reduce the excessive activity while regaining the parasympathetic control.
- A plot in Zone 2 is not as frequently seen as Zone 1 and 3 plots. In this quadrant, The parasympathetic dominant state should actually be regarded as a sympathetic insufficiency response. These patients classically have low adrenal function which suppress the release of Sympathetic neurotransmitters. They have drifted to where they are sluggish and unresponsive to the demands needed to live a functionally active life. They constantly feel exhausted and are needing to have there autonomics rebalanced to regain their vital responsiveness
- Zone 3 is where the majority of patients will be plotting as they enter Chiropractic Care. Classically they are sympathetic dominant with low Autonomic Reserve. The further down and lower left they plot, the more incapable they are in managing their daily stress; Those who remain in lower Zone 3 typically transition to zone 4 which is a very unhealthy state. Zone 3 patients being sympathetic dominant have a lowered immune responsiveness and a higher inflammatory response making them vulnerable to the next level of stress they need to respond to. Typically the persistence of vertebral subluxations drives people to Zone 4
- Zone 4 has the most dire outlook for the patient. They have low parasympathetic responsiveness and have very little reserve. We don’t see as many of these patients in a chiropractic setting because they typically are being managed with a more intensive medical approach. They have very little adaptive reserve to respond to the demands of any stress, making them extremely vulnerable to environmental or pathogenic stressors.
- The Green zone or Zone 5 is considered the ideal target for remaining in a well-adjusted state. It is very attainable to get and stay in the Green Zone for those under Chiropractic Care. The higher a person plots in the green zone the greater responsiveness they have for managing dis-stress and taking on more good stress!
It’s sometime convenient to name each of the the four quadrants:
- Zone 1 can be referred to as being wound up or uptight
- Zone 2 could be described as being exhausted
- Zone 3 as being distressed
- Zone 4 as being weakened
As well, I like to use a car analogy to relate the same four quadrants. Zone 1 is like sitting at a stop sign and revving your engine. Zone 2 is like trying to drive with your parking brake on. Zone 3 is like trying to drive with an empty tank and brakes that are failing. Zone 4 is akin to trying to drive with brakes that have seized. These everyday connections help to tell your patients the story of what you are measuring.
However you choose to describe the relationship of their situation it is important to remember that HRV is more related to parasympathetic insufficiency than lifestyle stressors.
David